In my last post, I described a speculative approach to the data generated by the New York Public Library’s What’s on the menu? project with the aim of identifying some data curation activities that might improve the usefulness of such an open data resource. After briefly assessing what I was seeing in the downloadable data set, I decided to work towards normalizing the names of the various “dishes” in the system. With this post, I want to talk about how I’m accomplishing this using Open Refine. What I’m describing here is not the construction of a tool or even a particularly robust workflow but hopefully a deepening of the exploration.
Strings are not what they appear
The comma-separated value (CSV) file on “dishes” in the downloadable data set contains around 395,000 rows. Each row contains information about one “dish” that users of What’s on the menu? have transcribed from the digitized historical menus on the library’s site. For my immediate purposes here, what’s most significant is that the data appears to contain an identifier (e.g., 470291), from which an HTTP URI for the item can be straightforwardly derived (http://menus.nypl.org/dishes/470291), as well as a string purportedly representing the name of the dish.
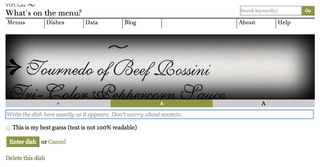
I say “purportedly” because the only evidence we have that the data in the second column is a name is the label of that column. (We’re also assuming that one row in the CSV file maps to one entity.) Assuming data to be exactly what it purports to be is a shaky proposition. The values in the “id” column check out as identifiers when we test them by constructing HTTP URIs and requesting the designated content. We can check the values in the “name” column by inspecting a few of them to see whether they conform to a colloquial understanding of names. We can also examine the transcription interface where these values were collected/created to try to assess whether anything there clearly maps to a concept of names. First, in addition to values like “Glace Framboise,” which seem relatively straightforward, we also have as values of “name,” strings like “ham steak, glazed pineapple rings, sweet potatoes, timbale of spinach a la financière.” The concept of “dish” is accommodatingly loose but there is some ambiguity whether this is one dish or two or three or four. Second, we can see that the concept of “name” does not appear in the transcription interface. Volunteers are shown a section of the digitized image and given a text field with the instruction: “Write the dish here exactly as it appears. Don’t worry about accents.”

The instruction to “write the dish” sidesteps tricky decision-making that might lower participation—volunteers only need to reproduce the string of characters in the image exactly as it appears (this is not as simple as it might seem). The designers of What’s on the menu? take the results of this human computation and store it in a field labeled “name.” This undocumented conceptual leap from “transcribing” to “naming” explains some of the quality issues with the data. Based on these two checks, we can’t assume that the values in the “name” column are all, in fact, names of dishes.
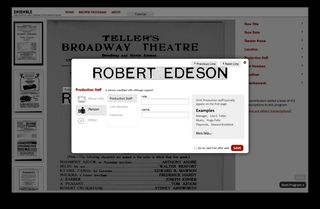
Of course, the New York Public Library (NYPL) Labs’ team is well aware that transcription interfaces need to be designed to scaffold complex tasks like the creation of high quality structured data. What’s on the menu? was the first of a string of successful projects. A more recent project using historical theater programs shows how NYPL Labs have designed a different interface to support volunteers in creating data about entities via transcription of images. The transcription interface of Ensemble asks volunteers to first decide “What type of info is this?” then displays relevant fields like “name” (explicitly labeled) based on the answer. In this later project, the data collection interface corresponds much more closely to the entity model represented in the underlying database fields. The greater sophistication of the transcription platform in Ensemble helps to bridge the gap between transcribing from images and creating data about entities. NYPL has improved the algorithm at work in their human computation.

Understanding how the data was created helps the prospective curator to realize that the data set from What’s on the menu? comprises not structured information about entities like “dishes” but rather partially-processed observations (transcriptions) of regions of high-resolution imagery. (Indeed the largest data file in the downloadable set is a mapping between “dish” identifiers and regions of images of particular menu pages identified by x- and y-coordinates.) Taking the labels of fields and columns in “Dish.csv” as authoritative would assume a transformation of the data from one state to another (observation of image to property of entity) that has not actually occurred (or at least, has not occurred purposefully or uniformly throughout the data set). Getting to an authoritative index of “dish” entities will require further curation.
Space to improve
Knowing that we’re dealing with “observational data” in the form of transcriptions should incline us to treat the values of “name” skeptically. Also this knowledge does much to bolster the original assumption that the size of the curation challenge is not 1.2 million dishes to normalize as the What’s on the menu? site proclaims, or even 395,000-odd dishes as the number of rows in the CSV file would suggest, but some smaller proportion of even that smaller number.
Since the first step towards an index of dishes will involve cleaning up the variant strings found in the “name” column of “Dish.csv,” I turned to Open Refine, which proclaims itself “a free, open source, power tool for working with messy data,” as the most obvious fit for the job. A common workflow for using Open Refine (hereafter just “Refine”) to clean up messy data involves loading in data, optionally doing some global transformations, then using the tool’s powerful clustering functionality to group very similar values that may in fact be duplicates even if purely algorithmic processes can’t definitely identify them as such. To start, I’ll follow that general pattern.
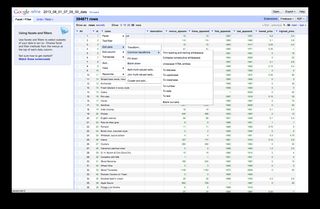
Normalizing values using transformations will probably turn up some additional matches even prior to trying the clustering methods. These are basic things like trimming leading and trailing spaces and collapsing extraneous internal spaces (between words) but even small whitespace variations prevent the computer from making exact matches between strings. Transformations are available in the dropdown menus in the header for each column.

I also transformed all values to lowercase to eliminate variations due to irregular or inconsistent capitalization. After just these procedures, the percentage of duplicate values for dish “name” rises from 0.009% (hardly worth expending effort to fix) to a little over 6% (perhaps small in itself, but the leap suggests that we’re a long way from the ceiling for improvement). In specific terms, this means that there are actually thirteen different identifiers assigned to the dish “cold roast beef” based only on small variations in white space and capitalization not any genuine ontological difference.
Powering the power tool
At 395,000 rows, the What’s on the menu? data set is substantial but can still be opened in a common application like Microsoft Excel. However, a data set of this size, with so many potentially-unique values does pose challenges for Refine when trying to use more powerful functions like clustering. To get the benefit of Refine’s capabilities for cleaning up messy data, I needed to be able to interact with the application programmatically rather than only through the standard graphical user interface (GUI).
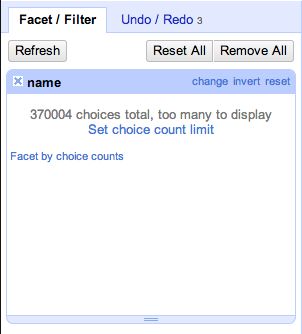
The first step in clustering involves generating what Refine calls “facets”—a list of the unique values for “name” found in the data set. Right away we run up against apparent limitations of the tool. After churning away for a couple of seconds, Refine reports that there are “370004 choices total, too many to display” and offers a link where we could “Set choice count limit.” This is frustrating behavior—we can’t see even a partial list of facets and it’s not immediately obvious how to make forward progress from this point. If we click on the link to set a higher choice limit count—up to 371,000 from the default 2,000, to accommodate the variation in the menus data set—Refine will obligingly attempt to calculate and display this many facets. Most likely, the browser page will become unresponsive and raise an error. In modern browsers, processes in different tabs are isolated from each other so only the Refine tab should crash but, in older browsers, the whole application may crash at this point: caveat emptor.

With only a few other browser tabs open—rather than the usual tens—this process actually succeeds on my machine after a minute or so. Yet even if the faceting process succeeds, the result slows the interface to a sluggish crawl and clustering still crashes the whole process. In a section titled, “Miscellany” under the help documentation for the faceting function, the maintainers indicate that you can raise the choice count limit but only “if you think your computer can handle it.” More interestingly, the help documentation goes on to say, that “whether ‘your computer’ can handle it or not depends mostly on your web browser.” I’m using Google Chrome on a fast machine so clearly, for the menus data, raising the choice limit count so far above the default is an unworkable hack. Nonetheless, this particular failure of the “power tool,” with the blame falling on the web browser, contains the seed of a “better” workaround.
This better workaround is predicated on understanding how the Refine application works. Refine uses a client/server application architecture but both the client (the web browser window as GUI) and the server live on the user’s computer. The server component is written in Java, while the front-end interface is written in Javascript. What’s failing when we try to cluster the values from the “name” column in the menus data is not the backend server application that is computing the facets but rather the Javascript application that manages displaying and updating the information. So, I reasoned I might be able to work around the frustrations of the current GUI, if I could just interact programmatically with the server component. There are links to old discussion forum posts as well as a number of actual client libraries in various programming languages for interacting with the Refine server in the official documentation. Often the motivation for “scripting” an application like Refine is to enable it to be used in “batch” mode—that is, without human intervention. That’s not my motivation here. As the documentation points out, clustering, which relies on human value judgements for merging very similar data values, can’t be done in this kind of batch mode.
Since I was going to have to go to the trouble of this workaround for the standard Refine interface, I did ask myself whether I still needed Refine. The string manipulation above could have just as easily been accomplished using the basic libraries of almost any programming language. A little digging around in the source code and some strategic googling revealed enough to quickly re-implement the main clustering method. So, I could have written more code and ended up with the same functionality I’ve gotten out of Refine so far. I suspect that down this path lies more and more re-inventing of the wheel. For this little speculative project, I am content to have both the standard browser-based interface as well as a programmatic interface open at the same time.
Clusters on command
I’ll discuss what this process says about the potential for curating the data from What’s on the menu? but I want to offer a few more details about working with Refine. This section may drift into technical detail but the client libraries that can be used to programmatically drive the Refine server are very poorly documented.
Based on what I read in the discussion forums and on a “sniff test” of the few source code repositories, I settled on using one of the more recently updated forks of the Python Refine client library. These client libraries do not work with official APIs. As the creator of this Python library explains, these libraries reverse engineer the Refine application by snooping the traffic between the browser-based client and the local server using tools like HTTP Scoop. As I mentioned, documentation is very scant, and, at least in the case of the Python client, the code is not very idiomatic, which makes it a little more challenging to decipher. However, it works just fine for the purpose of patching around the problem of overloading the GUI with too many facets.
The Python client library assumes that Open Refine is installed and the server component is running at the default address ( a different value can be passed in at initialization if necessary). Then, a couple lines are sufficient to setup a connection to the Refine server.
from google.refine import refine, facet

server = refine.RefineServer()
grefine = refine.Refine(server)
Most of the ‘commands’ return the raw JSON output that the server sends back. So, for instance, once I’m set up I can list the projects in my copy of refine—in this case just one comprising the August 1st version of the data set from What’s on the menu?
{u'2310205155087': {u'created': u'2013-08-16T20:45:49Z',
u'customMetadata': {},
u'modified': u'2013-08-16T20:56:56Z',
u'name': u'2013_08_01_07_05_00_data'}}
Figuring out how to do what I wanted (faceting and clustering on the values of “name”) took some experimentation—particularly in figuring out how to pick my way through the objects returned by some of the functions. For instance, to inspect the facets of the data, I had to get access to a dictionary called ‘choices’ that is part of the response to the ‘compute_facets’ function:
facet_response = nypl_dishes.compute_facets(name_facet)
facets = facet_response.facets[0]

for k in sorted(facets.choices, key=lambda k: facets.choices[k].count, reverse=True)[:25]:
print facets.choices[k].count, k
This produces a list of unique values and their associated raw counts:
13 potatoes hashed in cream
13 cold roast beef
11 club sandwich
10 lobster salad
10 hot roast beef sandwich
10 american cheese
10 clams: little necks
9 celery
9 american cheese sandwich
9 strawberry ice cream
I created a quick iPython notebook to demonstrate the details of how I’m using the client library to drive Refine.
Return on investment
The main thrust of this post has been demonstrating a “how to” for working around some of the limitations of Open Refine for cleaning and reconciling data like that from What’s on the menu?—where the size of the data set is in the hundreds of thousands of rows and where there is enough variation that the standard browser GUI cannot handle the load. The larger question is whether there is a still a plausible vision for how a data curator could add value to this data set. The need to script around limitations of a tool increases the cost of normalizing the NYPL data. At the same time, the ability to see the clusters of similar values that Refine produces increases my confidence that the potential gain in data quality could be very substantial in going from the raw crowdsourced data to an authoritative index. Using just the default method (usually the most effective), produced 25 thousand clusters that need to be evaluated and reconciled. In future posts, I’ll report on how well the combination of the standard graphical interface and programmatic control are working to help me improve the NYPL’s data.