This is the third part of a continuing series on curating data from the New York Public Library's What's On the Menu? project. The first two parts can be found here and here.
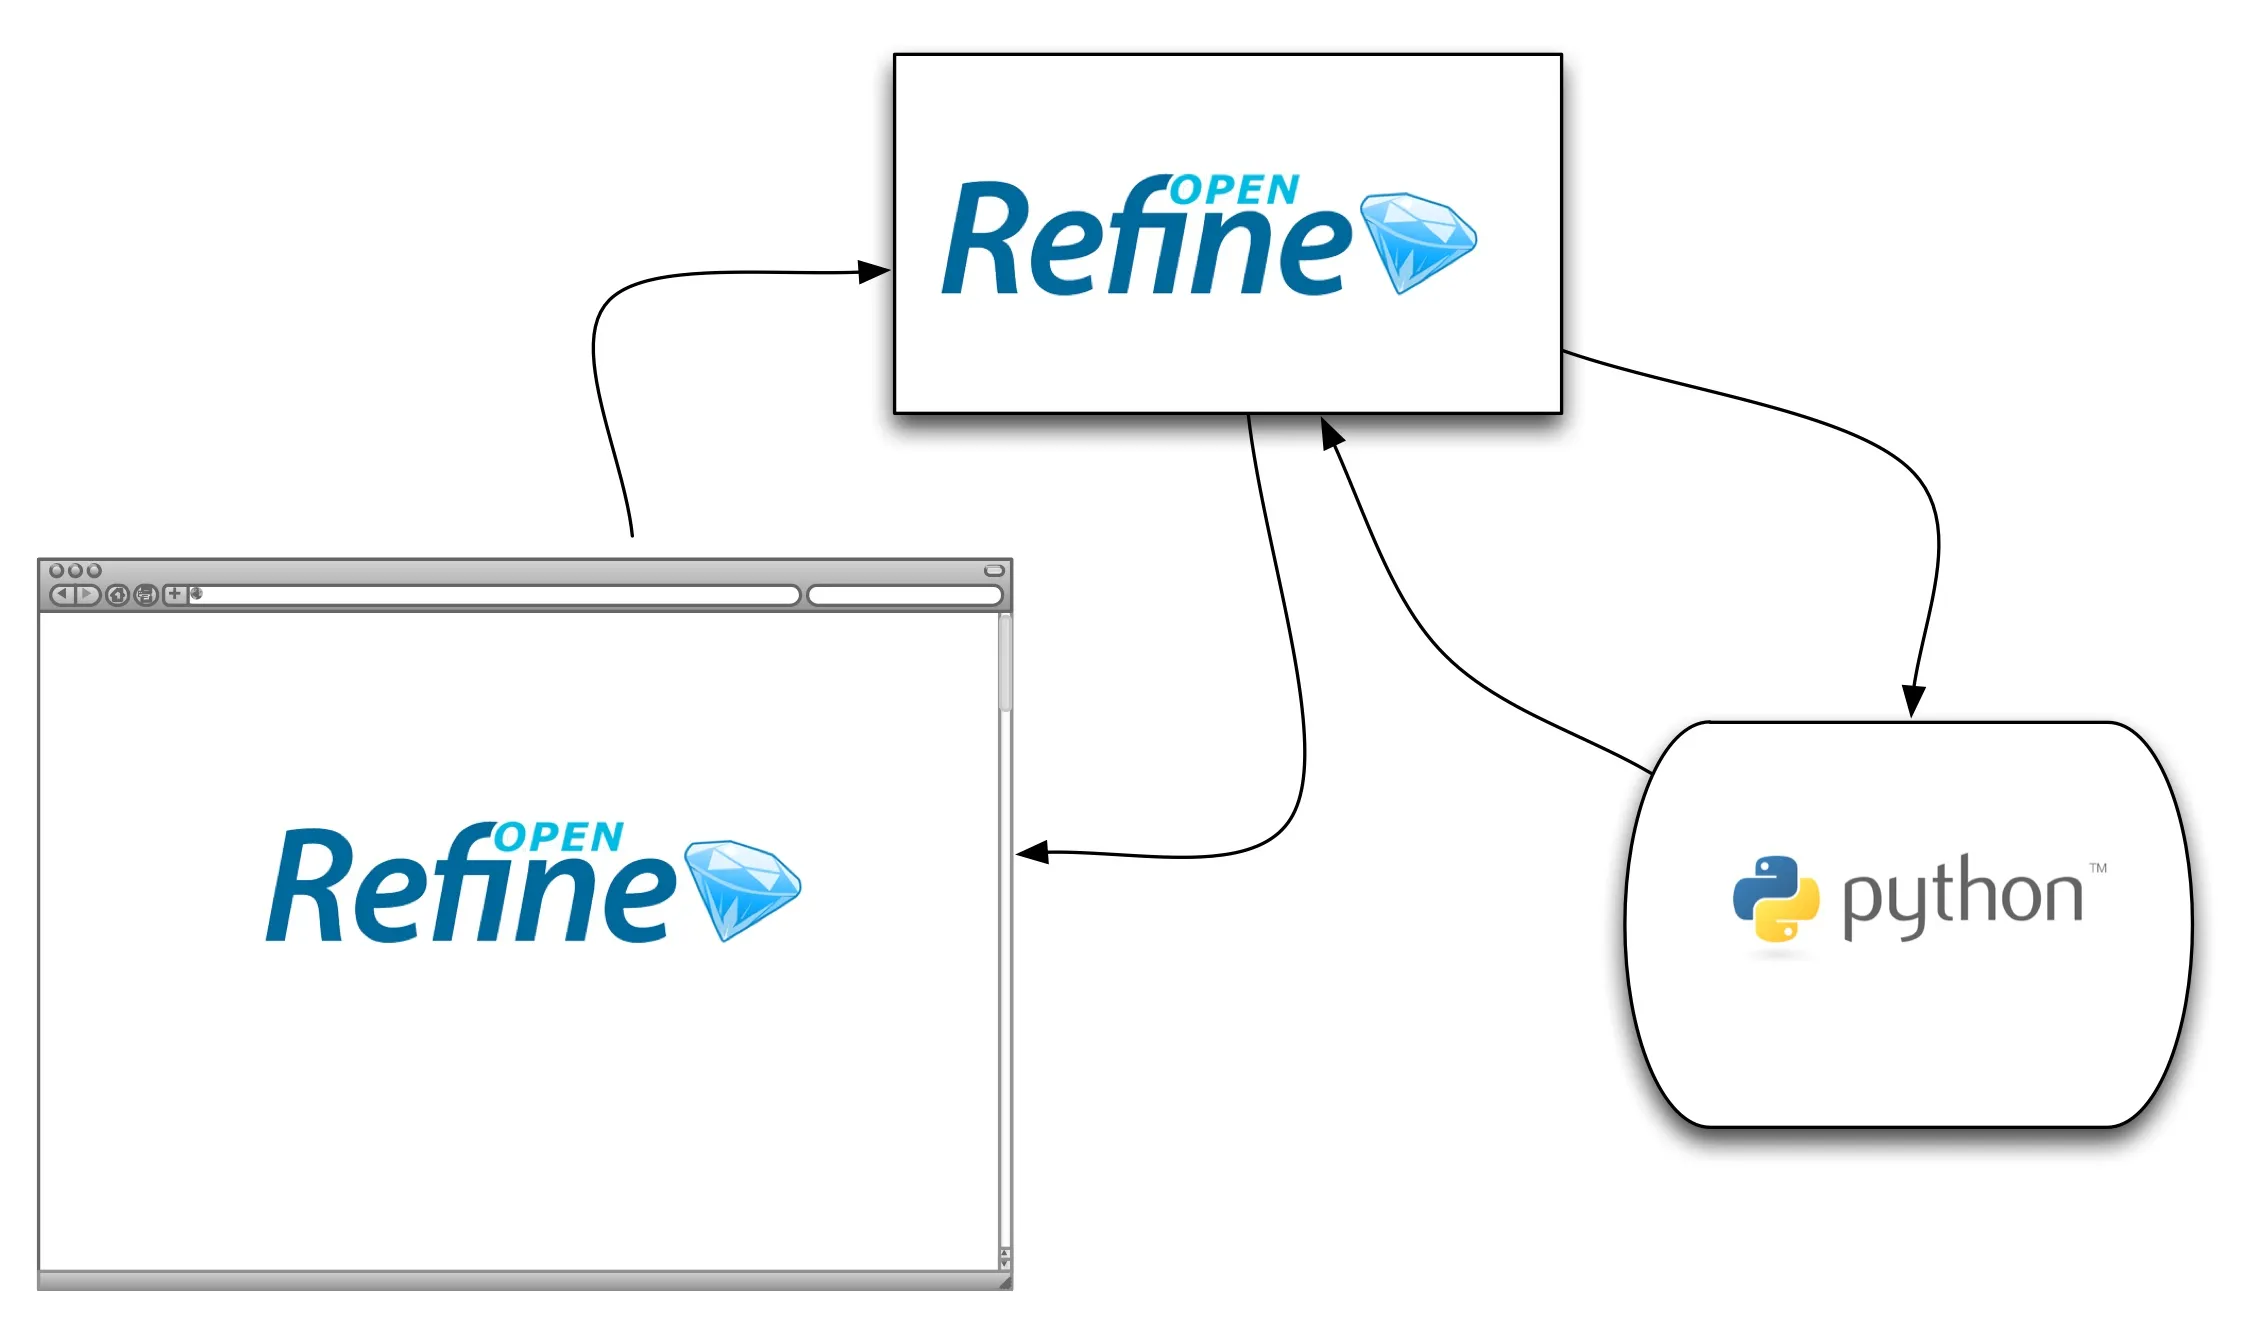
At the end of my last post about attempting to curate the open data from New York Public Library’s What’s On the Menu? project, I described how I was using a Python client library to communicate with the Open Refine server as a way around the tendency of Refine’s standard graphical user interface (GUI) to crash when attempting to facet and cluster the values for dish names in the nearly four hundred thousand row data set. Using this method, I’d identified about twenty-five thousand clusters of potentially duplicate name values that were candidates to be “cleaned up” as part of curation. I promised to report on how my hybrid client-program-and-GUI-interface was working for this task.
For me, the overall goal of this data curation work is to find ways of making the data from What’s on the Menu? more valuable for investigating historical questions about the cultural role of food.
Like the earlier posts in this series, what follows will be a mix of technical notes (what technologies, workflow steps, fateful decisions) and any accompanying conceptual insights about data curation that strike me as I explore. Working with the data from What’s on the Menu? gives me a chance to experiment with a bit of “hands on” data curation. These write-ups serve as a kind of “think aloud” protocol for that process. Some meandering is to be expected. I hope I have given enough signposts that readers uninterested in one component or another can skip ahead.
From Refine to … Pandas?
Reader, I abandoned Open Refine.
For problems of the right size, Refine can be used to get a lot of work done without the need to program or to know how to program. I recommend it enthusiastically and we introduce participants in our Digital Humanities Data Curation Institute workshops to Open Refine as a great data curation tool.
However, under my hybrid approach, I wasn’t gaining much by using Refine and most of what I would lose in moving away from Refine I could quickly and easily re-implement in native Python. Part of the power of Refine resides in precisely the fact that it offers a GUI for performing powerful and flexible data cleaning tasks. Since the size of my data set was overwhelming the GUI, I was writing code to do what I wanted anyway. Therefore my solution was not benefiting from the “easy-to-use”, no-programming-required quality of the tool.
(In fairness to Open Refine, a functional GUI within a web browser for operations on tabular data of this size—a few hundred thousand rows—appears to be an unsolved problem. GitHub, which now allows users to display and edit CSV files online, punts on the problem of presenting data sets this size, saying “We can’t show files that are this big right now.” Microsoft Excel shudders a bit working with the larger CSV files in the data set but remains functional so I wonder if something about “web stack” UI code is the problem—in Refine’s case there’s no network load to consider since the server is on the same local machine. But I’m no software engineer and I digress …)
For the problem of normalizing a few hundred mostly-unique names of dishes transcribed from historic menus, continuing with Refine was costing me more than it was benefiting. Since I was scripting the Refine server, I ended up doing a lot of packing and unpacking of data structures—from the JSON requests and responses the server produced to Python objects created by the client library to my own improvised data structures and back again—all to accomplish any data cleaning task. My workflow using the Refine client library was to: load the data into Refine and make some simple global changes (stripping extra whitespace, lowercasing, etc.) directly in the GUI, then, proceeding with the (command line) Python script, cluster the data in the “name” column, and manipulate the clusters of potential duplicates independent of Refine until it was time to formulate a kind of patch and normalize the clustered values I’d reviewed “out of band.” I could check my work in the GUI afterward.
In this scenario, Refine functioned as an in-memory data store and a way of executing one method (the fingerprint clusterer) as a remote procedure call. Perhaps this scripted workflow could have been finessed but it would always be a workaround. By sticking with Refine I was giving up not only the built-in GUI interface but also libraries and other tools in Python that were specifically intended for the kind of task I was doing—the worst of both worlds.
A little reading of the Refine documentation and some helpful comments in the source code for clustering function revealed that it wouldn’t be too hard to reimplement the basic fingerprint clustering algorithm. Removing the need to depend on the Refine server for that one remote procedure call was the last impetus to switch tools. In switching tools, I was free to move from a general-purpose tool (Refine) to a tool that I could shape exactly to the needs of my particular task.
I decided to see whether the Pandas Python library could help. Pandas is a Python data analysis library that is increasingly popular for scientific computing. Furthermore, the library integrates nicely with the IPython notebook, which has become my go-to environment for coding tasks. This move allowed me to take advantage of data structures and associated tools designed for working with large amounts of data (much larger than my dataset).
Before I describe more of the technical details of this new approach, I want to reflect a little on one of the other functionalities I was given up in abandoning Refine: a robust logging mechanism. Poorer logging capability may not seem like much but this technical decision suggests some conceptual distinctions.
The Relation of the Curation to the Data
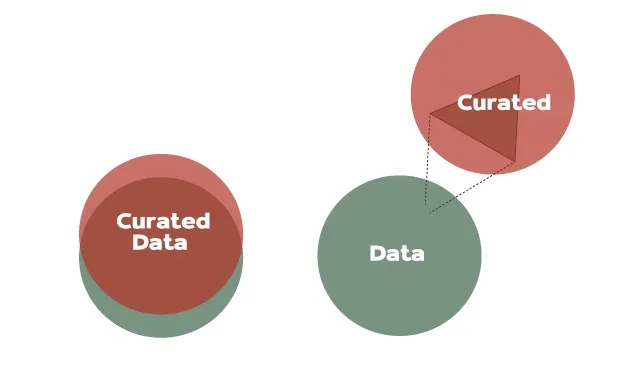
It turns out that I didn’t need Open Refine to cluster the values for dish names and identify duplicates—but what I will miss is Refine’s logging capabilities, which underlie the “Undo/Redo” functionality. Unpacking the reasons why I’ll missing Open Refine’s logging capability made me think about the relationship between the “raw” data that NYPL publishes and any curated data I might produce. Specifically, I had to admit that what I’m working to produce will not be a cleaned or processed version of the data set but will be more like a supplementary information resource about the original dataset that helps organize and connect it to other resources (one hopes). This distinction is worth unpacking a bit more.
Perhaps in some cases, what happens to data as part of curation is a progression through increasingly refined and improved iterations but the experience of working with the menu data complicates this commonplace (?) assumption. In my head, I’ve started to describe what I’m doing with the NYPL data as creating an index (loosely akin to back-of-the-book indexes) to the original data set rather than a new version or edition of that data. If we’re talking about data curation in terms of producing versions of data we might draw on scholarship from bibliography, textual criticism, and book history to inform new practices. If we’re talking about data curation in terms of producing new information resources about data sets then we may draw more from information science scholarship on cataloguing, abstracting, and indexing (Cf. Ron Murray’s discussions of the “Graph Theoretical Library”). Of course, both kinds of curation may be happen over the entire lifecycle of maintaining data’s “interest and usefulness to scholarship” (Cragin et al 2007). What changes is the relation between “the curation” and the data.
This potential nuance arose too late to address in my recent piece on “Data Curation as Publishing for the Digital Humanities” but it merits further elaboration in that context and I remain interested in what the “bibliographical imagination” [paywall] has to say that might inform data curation work. I don’t want to belabor a minor point. A comparative examination of data curation in different domains would probably show a healthy diversity in the kind of relationships that subtend between less-curated and more-curated data sets. A vision of successive, increasingly-perfected-and-enriched versions of data marching into the future is perhaps only a lazy mental shorthand for “data curation.”
The Log as a Representation
What does this have to do with logging? In my case, grappling with whether and how to keep a log of the actions I was taking on the dataset (something that Open Refine provides but my bespoke solution would not) became a spur to think too about provenance and the distinctions between curation and preservation.
In the midst of considering this question, I happened to read a blog post from an unrelated context—software engineering for real-time distributed systems (in this case, the professional networking site LinkedIn)—that suggested some of the conceptual stakes to the question of whether and how to log changes. That post, by one of LinkedIn’s principal engineers, is a dense and fairly technical paen to “logs,” which the author defines as “perhaps the simplest possible storage abstraction. [The log] is an append-only, totally-ordered sequence of records ordered by time.” One of the most salient aspects of logs for the purposes of data curation is nicely summarized in a shorter post by the Head of the Data Engineering team at Etsy:
The point of [the LinkedIn] post is that a log containing all of the changes to a data set from the beginning is a valid representation of that data set. This representation offers some benefits that other representations of the same data set do not, especially when it comes to replicating and transforming that dataset.
For a data curator, one benefit of a log as a representation of a dataset (which the LinkedIn engineer does not mention because it’s not in his use-case) is that such a representation is well-suited to documenting the “provenance” of data. The notion of provenance is a big deal in archival theory (certainly one of data curation’s progenitor fields) and is defined, according to the Society of American Archivists’ Glossary, as “a fundamental principle of archives, referring to the individual, family, or organization that created or received the items in a collection” (and accordingly archivists’ obligation to maintain evidence of this context). So “provenance” often refers to both the original context of records and the chain of evidence demonstrating the same. The emphasis on provenance relates to the original mission of archives. As Lorraine Daston pithily explains in a fascinating essay on historical consciousness in science [paywall]: “Early modern archives were bastions of authenticity, places of proofs and pedigrees” (171). The weightiness of these social functions of early archives still trails along behind the concept of provenance like an ermine hem. Many digital preservation systems and standards, attempting to live up to this responsibility perform some kind of logging or provide mechanisms for recording of all the actions that affect data. I think it’s important to note that this kind of tracking and logging does not fully encompass both senses of archival provenance above—perhaps why the PREMIS preservation metadata standard refers more modestly to “digital provenance.” Nonetheless, giving great weight to provenance or even digital provenance might encourage us to think primarily about curation in terms of delineating and preserving versions of data.
In trying to square the notion of curation work that does not produce a (better) version of the NYPL data set but rather an information resource about the original, it is helpful to reassert that archival concerns are but one (surely vital) subset of curation. Librarians and other cultural heritage professionals, in addition to performing vital preservation functions, have “curated” in other ways for a couple hundred years—normalizing and increasing the value of information by building catalogs and indexes. Curation need not always be logged.
To put this question back into practical terms, I wondered how, without a log or some similar mechanism to track changes, I would best be able to submit the results of my work back to NYPL. And if I’m not even any longer working toward a cleaned up version of NYPL’s data set (without yet giving up hope of being useful)—what then?
The question cuts both ways. What value would an information resource about a messy data set hold and what value will the original transcriptions have if there is some more “correct” data somewhere else? In the same essay mentioned above, Daston describes how research on the ways that early modern “scientists” made use of archives suggests that one way that these scholars regarded archives and libraries was as “provisions laid up for future inquirers” (surely resonant with our current understanding of data curation and its aims). This sense was particularly acute with regard to observational data (as it still is). Daston tells the story of how French astronomer Jacque-Dominique Cassini IV (great-grandson of the more-famous Italian astronomer for whom the unmanned spacecraft conducting the most in-depth study of Saturn is partly named) recommended that Académie Royale des Sciences keep a few sheets of astronomical and meteorological data produced by an earlier scholar even though they were “in rather bad order” (172). One wonders how the archivist (?) on the other side of this appraisal conversation felt about Cassini’s recommendation. “Even rough, badly made observations were considered valuable enough to be preserved for posterity,” after all, Daston writes, “who knew when an apparently trivial or even sloppy observation might turn out to be invaluable?”. For Daston, this is suggestive of how “early modern empirical inquiry was an archival science” but, more generally, I think I think it says something about the relationships between original (or at least earlier) data and curated data.
There are messes in the data from What’s on the Menu? and there are insights to be gained from cleaning them up—I’ll some show of these below—but there is also value in curatorial actions that expand the field of view beyond the single node of an original data set to a network or graph of representations, many of which may be new resources about the original data rather than versions of it. This second type of data curation is one that librarians may, in fact, be better equipped to accomplish than the original data curators or domain experts. Thus, in working with the NYPL data it became less urgent to “track changes” and thus the log as a representation of this particular data set diminished in importance for my use case.
Dataframes
That’s the theory but at the end of my last post it was not clear whether I had the (right) tools to do much curation in practice when working with a data set that, while not “big”, was no longer of a trivial size. In Pandas, the Python data analysis library, I think I have found some excellent tools for the job. I want to show a little of how these data analysis tools are useful for data curation.
Pandas works better as a computational tool for my use case than Open Refine because it is based on a more powerful abstraction for tabular data. Specifically, Pandas is built on a foundation of n-dimensional arrays, which some of us may have encountered before in high school math class. (There is however no math required to follow this discussion.) One advantage of using arrays as the underlying abstraction is that this makes it possible to perform operation on whole blocks of data very efficiently. Pandas builds on the array from Python’s numerical (read: statistical) computing library to (as it says on the tin) “provide sophisticated indexing functionality to make it easy to reshape, slice and dice, perform aggregations, and select subsets of data.” The main mechanism for accessing these additional capabilities in Pandas is via the DataFrame object (similar to the R language’s data.frame). For more detail, I recommend the book, Python for Data Analysis by Wes McKinney (source of the previous quote).

By using a tool designed for high-performance analysis of large data sets, I gained speed and flexibility in manipulating the data from What’s On the Menu? even though the data in my case was not primarily numerical. At the most basic level, I could increase the amount of data I had loaded and available for work. When I was using Refine, each comma-separated value (CSV) file became a separate “project” and I was limited to working with one at a time. Also, the DataFrame is computationally efficient so the larger files in the NYPL data set no longer posed problems. The CSV file that maps dishes to the positions where they appear in the images of the scanned menus is a hefty file (113.6 MB in the latest download) and Refine is basically unable to load this file into memory. Furthermore, in Pandas I could recreate more of the linkages between related data in the various files. The CSV files in the NYPL data set are created from relational database tables and they contain keys that are intended to allow them to be linked together. Mimicking a relational database is obviously not what Refine was designed for but Pandas does provide SQL-like functionality that allowed me to take advantage of these linkages. Rather than being limited to one project representing one CSV file, I could quickly and easily load two or more CSV files into Pandas DataFrames and work with both or several at the same time.
Many operations which I formerly had to perform myself are simply built in to Pandas. A good example relates to doing basic inspection of the data set for quality issues. Under my old method, to see how many unique values there were in the “name” column of the data about dishes, I had to either call Refine’s faceting function (and wait) or loop through the various rows of a CSVReader object pushing each value of name into a dictionary as keys (which must be unique). After lowercasing or stripping whitespace, I’d do it again then see if the number of keys decreased as duplicates were found. In Pandas, I just call the “unique” function on the name “column” and get a count. As I learned to take advantage of the functionality Pandas provides, I began to find numerous examples like this.
I did have to learn to think about how to accomplish my goals in a more functional rather than procedural style. Writing code that’s intended to loop through a bunch of rows (as though one were manipulating a CSV) basically vitiates the advantages of having data in a DataFrame. The “Pandas way” is to perform operations on all of the data in an array at one go. So, with a little mind-bending, I learned to think in terms of map-and-reduce paradigms for applying functions to data and to understand the power of “GroupBy.”
For those interested, I put together an IPython notebook demonstrating some uses of Pandas for clustering and finding duplicates in the dishes transcribed by the NYPL’s online collaborators.
At this point, the reader could be forgiven for asking (maybe not for the first time): so what? Pandas DataFrames are nifty and powerful but what’s the payoff? To wrap up this post, I want to show some small results and suggest how to generate more and larger ones.
How many French Fries?
All the clues that there is room for improvement in the What’s on the Menu? data can be found on the page for any dish, under the heading of “Related dishes”:
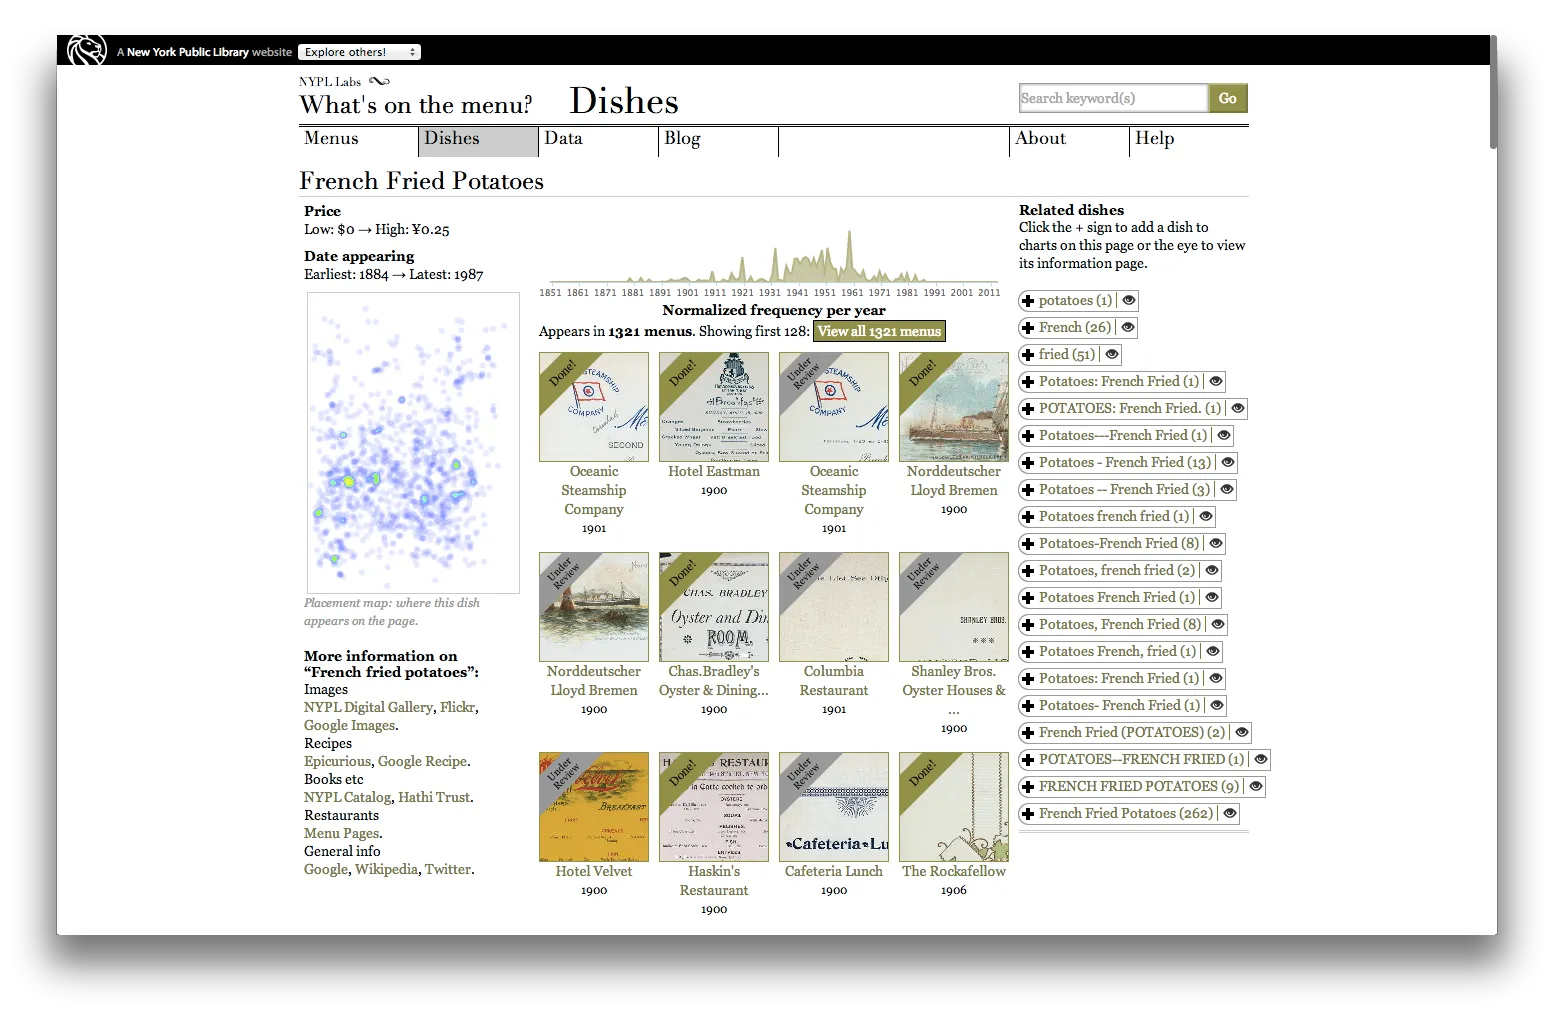
These are not so much related dishes but un-normalized duplicates of what appears to be a single dish type. The duplication in the data set undermines the ability of interested users to view and browse meaningful patterns of co-occurrence among dishes. By extension, the ability to trust the summary information about first and last date of appearance, highest and lowest price, and total frequency of appearance over time is all thrown into doubt. In the accompanying IPython notebook, I used the case of “French-fried potatoes” to demonstrate how cleaning up duplicates allows us to revise this potentially analytically significant information. Instead of appearing on 1,321 menus, when all the variants are counted together, “French fried potatoes” appears on 2,140 menus. In comparison with the data on the page for Dish 1259 (above), the date range for the aggregate “French fried potatoes” appearance is very similar: 1884 to 1989 (instead of 1987). But, for other variants in the long tail of “errors,” e.g., Dish 14987, the changes are more dramatic—23 appearances to over two thousand, a date range that expands from 1896 to 1969 to the full 105 years above. For the rest of the twenty-five thousand sets of duplicates identified by the clustering algorithm it’s possible to go through a make similar adjustments. The analytical payoff of course is not in the these individual changes but in the overall changes in food trends that appear.
To realize these gains it is sufficient to able to point at slices of the original data—the changes do not necessarily have to make it back into NYPL’s systems. The ability to perform a kind of non-custodial curation is a powerful benefit of the NYPL’s design decision to assign URLs to every part of the data. Thus, it is possible to express the curatorial work on the data set as linked data embedded in simple HTML. In terms from earlier in this post, the curatorial product can be a new information resource that points (using linked data standards) into the original NYPL data. Other agents on the web can then come along and take not only the original NYPL data but also, if they wish, the “corrections” we have made to that data without any need for pre-coordination. I’ll give one quick example of one form this might take. For the duplicates in the case of “French fried potatoes” I could publish a bunch of statements of the following form (here using schema.org microdata for clarity):
{% highlight “markup” %}
{% endhighlight %}In this case, rather than asserting that all the URI’s in the “French fried potatoes” cluster are the same as each of all the others (very verbose), I am asserting that all of these dishes are the same as the dish identified by the Wikipedia URI. (The nuances of using “sameAs” for complicated historical information are fodder for another post.) The other benefit realized here is that it’s not strictly necessary to fuss over which string is the “best” representation of the French fried potatoes dish (so as to be able to change all the other values of name to that particular string). As a first pass, I can simply select the most common name value in a cluster and use that as the human-readable name for convenience. The ability to reliably reference sets of duplicates by their URI’s is unaffected.
Is There More to Do?
In a future post, I want to talk more about the idea of non-custodial curation and how the availability of the NYPL data on the web makes new experiments in this direction possible.